
Phase 25 / Failure Atlas
Find the misses behind the average.
Which frames did the robust detector recover, and which did it lose?
One frame. Six camera views.
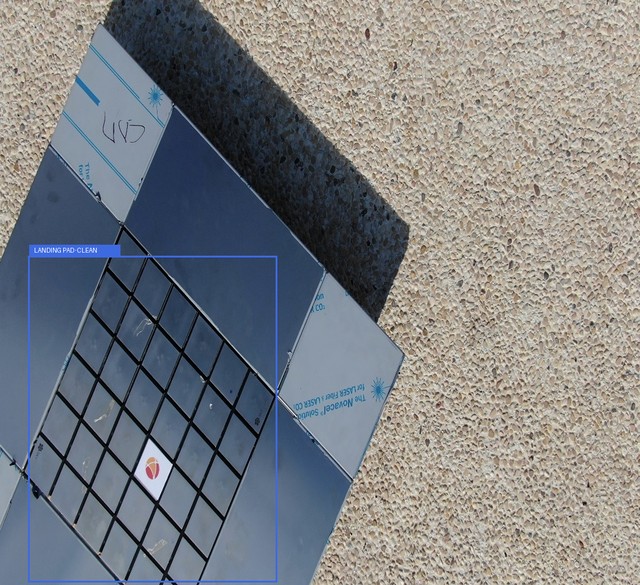
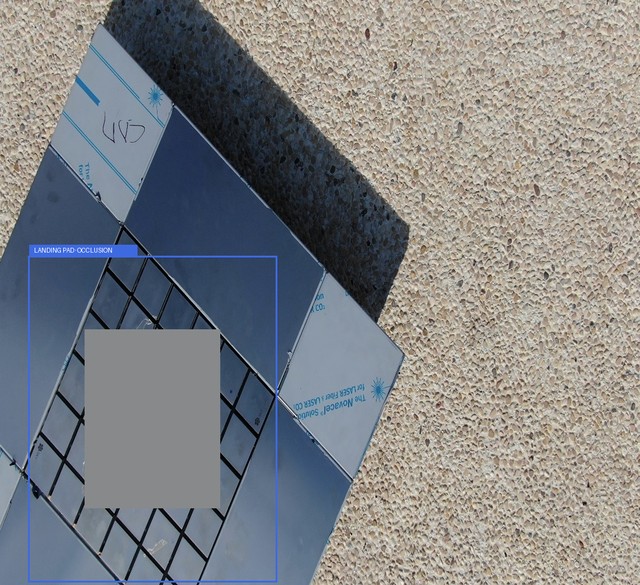
Scores summarize 86 reused test frames per condition.
Blue boxes are source annotations, not either detector’s predictions. This image illustrates published condition aggregates. Both models’ measured frame metrics and prediction boxes are in the interactive Atlas. Scoring uses every prediction; the visible boxes are a display-only subset.
The interactive comparison is unavailable. Read the published condition audit.
Every pad. Every condition. Both detectors.
- 01
Match predicted boxes to annotated pads one-to-one.
- 02
Count recovered, regressed, and shared frame outcomes.
- 03
Check whether detector scores track box correctness.
Results come after the inputs.
The 86-frame set was already used in Phases 23–24. Phase 25 is a retrospective audit, not a fresh confirmation set.
The source images and reconstructed stresses match frozen hashes. The original Phase 23 checkpoint has been recovered and authenticated. Both detectors have been evaluated across all 516 views, producing 49 recovered, 65 regressed, 223 both-pass, and 179 both-fail paired transitions.
Read the frozen protocol ↗Phase 26 separate-data plan ↗ · Phase 26 admission audit ↗Two paired comparisons. Two different questions.
The same-view comparison asks which detector matched the target. The clean-versus-stressed comparison asks how each detector changed from its own clean view.
516 cross-model views: 49 recovered, 65 regressed, 223 both-pass and 179 both-fail. Each compares the baseline with the original Phase 23 detector on the same frame and condition.
860 within-model pairs: two detectors × 86 frames × five nonclean conditions. Each stressed view is paired with that detector’s clean outcome, not with the other model.
Frame success requires matching annotated targets at IoU ≥ 0.50 and confidence ≥ 0.001; it permits false positives. Official aggregate recall uses the evaluator’s operating point and is a different measure. Neither measure is landing success.
The observed size, score and error associations do not establish why training or resolution changed the outcomes. Learned concentric-feature specialization remains a hypothesis, not a demonstrated causal mechanism.
Download the 860 generated pairs ↗ · Check the exact-match receipt →Confidence fades before a universal cutoff appears.
Separate recovered-baseline Q95 occlusion v2 evidence, replayed from 145,169 saved detections. This is not a new Phase 23 detector run.
Read the controlled dose response →Across approximately 0–74.6% measured annotation-box occlusion, matched frames changed from 53/86 to 48/86. Mean best-overlap confidence fell from 0.312 to 0.065; mean best IoU from 0.609 to 0.554.
33 frames already failed at zero added dose. Among the 53 clean successes, first sampled losses occurred for two frames at requested dose 0.15, three at 0.30 and two at 0.75. Recall fluctuates across the grid; no universal failure threshold is established.
land_pad changed from 33/66 to 28/66 matched frames; land_pad2 retained 20/20 throughout. Only one object class and two dependent sequences are represented.
The original raw-source attempt remains INCONCLUSIVE: clean gate FAILED, no treatment inference. The separately frozen v2 result does not replace it.
Archived topology study. Separate evidence.
The retained 5,160-view study compares four mask topologies and 15 doses on the same 86 frames. It is distinct from the six-dose recovered-baseline v2 curve and was not rerun in the latest revalidation.
Reported archived comparisons: Under the study’s stated Bonferroni family-wise threshold (αadj = 0.05 / 6 = 0.00833):
- OUTER_RING vs STRIPED: Statistically significant (Δ = +5.24 percentage points [95% CI: +1.55, +9.15], p = 0.002). The retained grid reports a higher matched-frame rate for outer-ring masks than stripes; this does not establish a causal training-resolution mechanism.
- OUTER_RING vs RANDOM_PATCH: Nominal association (Δ = +2.82 pp [95% CI: +0.39, +5.27], p = 0.010); does not meet the multiplicity-adjusted threshold.
- CENTER vs OUTER_RING: Overall difference is not statistically significant (Δ = −2.39 pp [95% CI: −4.96, +0.08], p = 0.062).
- Center-Sensitivity Verdict: Inconclusive / Suggestive. On distant/small targets at severe doses (≥0.50, N=66), an observed descriptive difference of 9.28 pp was noted (34.1% vs 43.4%, nominal p = 0.012), but does not meet the family-wise adjusted threshold.
- Monotonicity Observation: Empirical binned success rates exhibit non-monotonic fluctuations due to discrete image composition; overall downward trends appear primarily in fitted regression models.
Machine-Readable Evidence Artifacts:
Study Report (Markdown) ↗ · Analysis Summary (JSON) ↗ · Statistics (JSON) ↗ · Amended Protocol v1.1 ↗ · Fairness Decision ↗ · Zero-Dose Identity Gate ↗
Epistemic Limits: Evaluated on 86 static KIOS test frames from 2 video sessions under synthetic neutral-gray occlusion masks. These results demonstrate pattern-specific detector sensitivity on a static image benchmark and do not establish flight safety, airworthiness, or real-world operational certification.