Phase 22 · BaselineLoading results
Frame image not loaded. Select its local source image to view measured boxes in context.![]()
 AEGISLANDMODEL VASE
Phase 25 · Failure Atlas
86 verified frames. Six camera conditions. Compare measured original-model predictions.
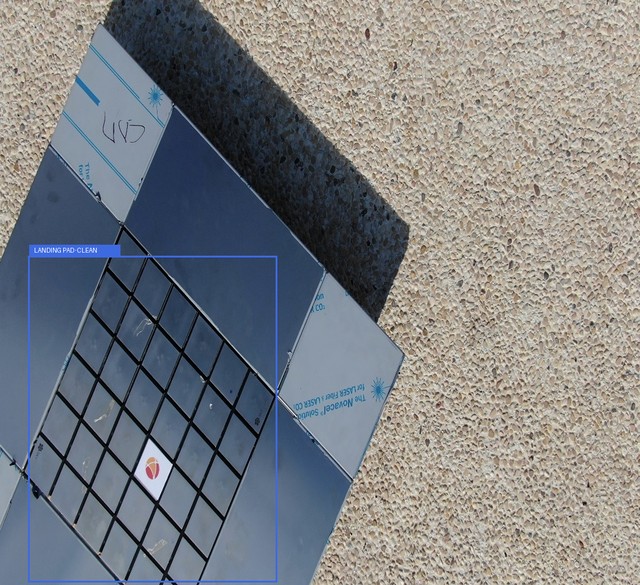
Frame explorer
Both original models are measured across 516 paired views. The 860 within-model clean-vs-stressed pairs are a separate comparison; none of these views is independent validation.
Published condition aggregate · Clean: mAP50 — · recall —. These aggregates are distinct from the selected frame metrics above.
Original-checkpoint replay: all 24 aggregate cells and four prediction tables matched ↗Filter the record
Descriptive filters only. These frames have already been evaluated.
Confidence and correctness
Showing measured baseline boxes with score ≥ 0.01, plus any matched boxes below it. All 136,359 predictions are available in the complete table. Box correctness does not measure landing safety.
Evidence and provenance
Inputs verified. Baseline and Phase 23 predictions evaluated on 86 protected test frames. 5,160 treatment views analyzed in controlled occlusion topology study.